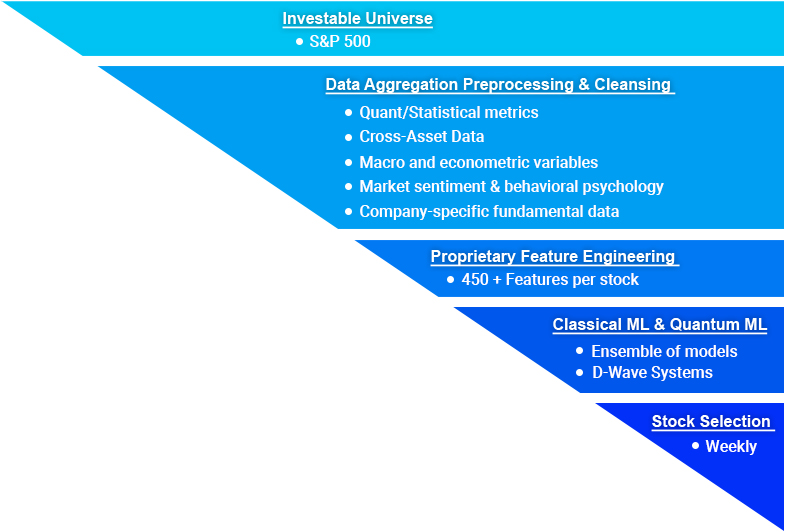
AFT Portal

A first of a kind, quantum-enabled, AI-driven investment framework.

Strategy Profile

Fully systematic strategy based on our AI-driven model that constantly learns and adapts to evolving market dynamics. The algorithm combines over 450 different features and metrics per each stocks, into AI model which has been trained to recognize short to medium-term emerging and persisting trends in the market. Highest ranked stocks based on the model’s conviction for the likelihood of outperformance (above a threshold) are then selected into the portfolio each week.

Objective

To deliver superior, risk-adjusted returns on a consistent basis

Investable Universe

Large Cap U.S. Equities (~S&P 500 constituents)

Rebalancing Frequency

Weekly

Number of Holdings

Variable

Weighting Scheme

Equal-Weight

Benchmark(s)

S&P 500 Index/Eurekahedge AI Hedge Fund Index

Investment Process

This process is underpinned by our proprietary hybrid framework, which fuses Quantum Computing with classical Machine Learning. We leverage D-Wave’s architecture, where a quantum machine learning algorithm is trained by a hybrid system involving both quantum annealing and classical optimization methods, in order to analyze thousands of data points and derive weekly portfolio selection.

macbook

Historical Data

Annual Historical Performance

2023** 2022 2021 2020 2019 2018* 2017* 2016* 2015* 2014* 2013* 2012* 2011*
AFT QML1 12.25% 2.38% 14.15% 15.13% 45.41% 2.66% 29.31% 44.48% 18.78% 34.33% 41.75% 37.61% 25.60%
S&P 500 Index 24.23% -19.44% 26.89% 15.93% 30.34% -5.30% 19.42% 9.54% -0.73% 11.39% 29.60% 13.41% 0.00%
Eurekahedge AI Hedge Fund Index 6.53% -4.30% 2.95% 11.24% 6.29% -4.31% 8.41% 10.16% 17.90% 10.57% 14.13% 1.96% 16.61%
Relative (vs. S&P 500 Index) -11.98% 21.83% -12.74% -0.79% 15.06% 7.95% 9.89% 34.95% 19.51% 22.94% 12.15% 24.21% 25.61%
Relative (vs. EH AI Index) 5.72% 6.68% 11.20% 3.89% 39.12% 6.96% 20.90% 34.32% 0.88% 23.76% 27.62% 35.66% 8.99%

* - Backtested performance, calculations on a close-to-close basis, exclude execution & transaction costs

** - As of December 29, 2023

Compounded Annual Growth Rate

1 year 2 years 3 years 5 years 7 years
AFT QML1 12.25% 7.20% 9.47% 17.04% 16.52%
S&P 500 Index 24.23% 0.04% 8.29% 13.92% 11.70%
EH AI Index 6.53% 0.97% 1.63% 4.41% 3.68%

Annual Statistical Summary

Annual statistical summary of the historical performance of our strategy (AFT), compared to the market (S&P 500 Index) and the Eurekahedge AI Hedge Fund Index, an index of the performance of underlying hedge fund managers who utilize artificial intelligence and machine learning theory in their trading processes (EH AI Index)

AFT S&P 500 EH AI Index
Average: 24.91% 11.94% 7.55%
Median: 25.60% 13.41% 8.41%
Max 45.41% 30.34% 17.90%
Min: 2.38% -19.44% -4.31%
Volatility: 15.19% 14.97% 7.06%
Sharpe Ratio: 1.64 0.80 1.07
Beta: 0.55 0.13
Correl: 0.54 0.28
Tracking Error: 14% 15%
Treynor: 0.45 0.57
Information Ratio: 90% -30%
Jensen Alpha: 18% 6%

Subscribe Now

Subscribe to receive current updates to the selection portfolio on a weekly basis and get access to all of the historical picks as well!

1-month FREE trial with any subscription. Cancel at any time.

macbook

Monthly

$99.99/month

Weekly Updates

Historical Portfolio Access

Annually 50% Off

$49.99/month

Weekly Updates

Historical Portfolio Access

Semi-Annually 30% Off

$69.99/month

Weekly Updates

Historical Portfolio Access